On the platform of Pattern Analytics Lab, Systems Science students analyzed municipality open data of invoices and suppliers. The students delivered analysis in the form of dashboards and described the possibilities (and challenges) of analyzing public sector digitalization through the prism of external spending. One fascinating insight from the project presentations on November 1st was on how to move forward from seeing this data not as compliance and transparency activity but rather as an input for innovation and service design.

Explore the data yourself using the dashboards below! Note how different is the supplier landscape in each municipality. First, check out the cross-municipality comparison. Who are the big players in supplying (and guiding) digital services? Then, check out dashboards for each individual municipality. All provide a different take on what is seen (or hidden) in municipality open data. Note that the dashboards are best viewed on a large screen (sorry, mobile readers!). Feel free to reach out to the students who participated in the analysis to get further insight and executive summary reports!
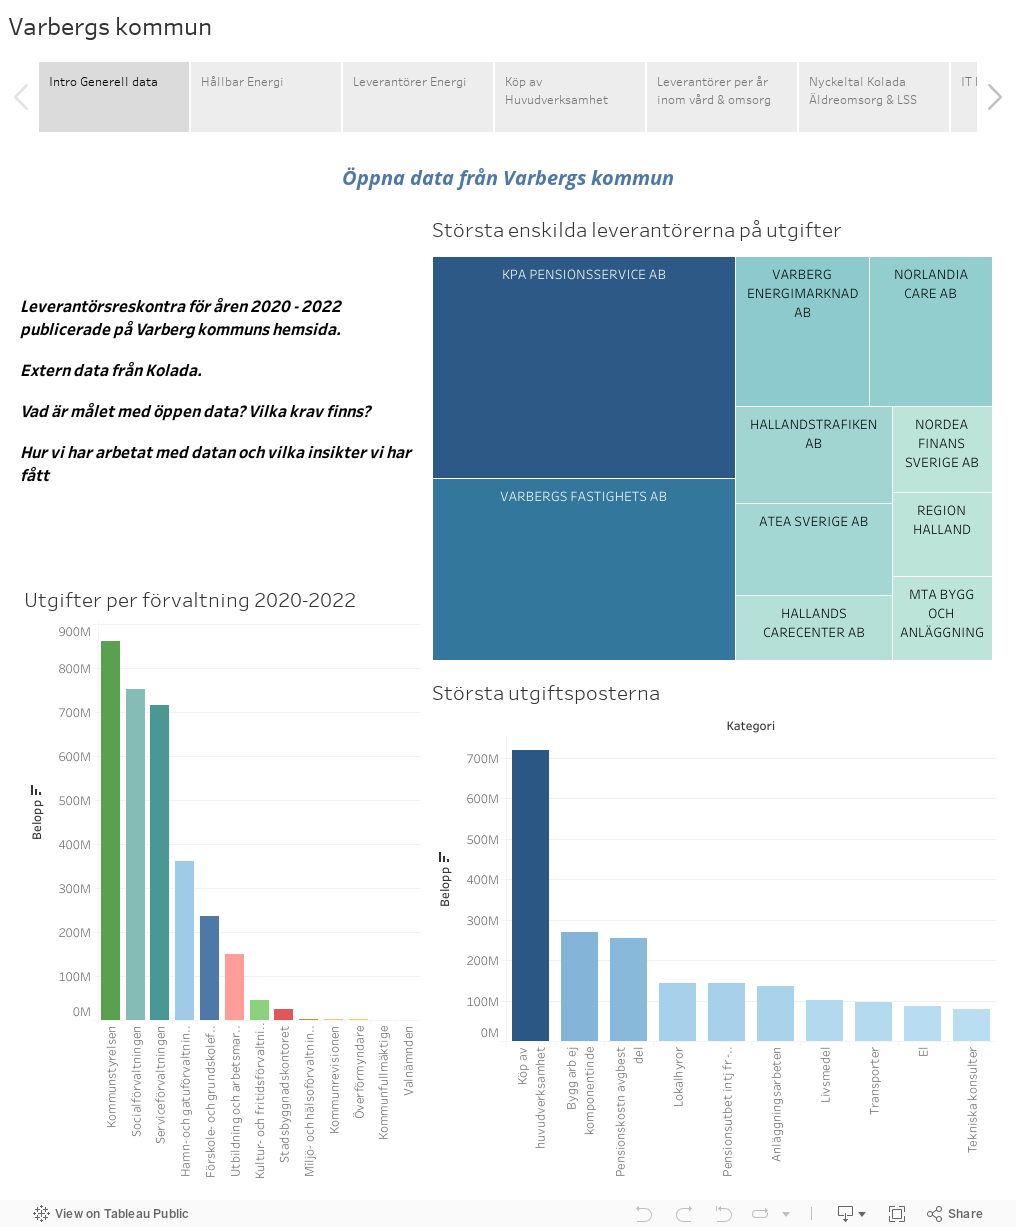
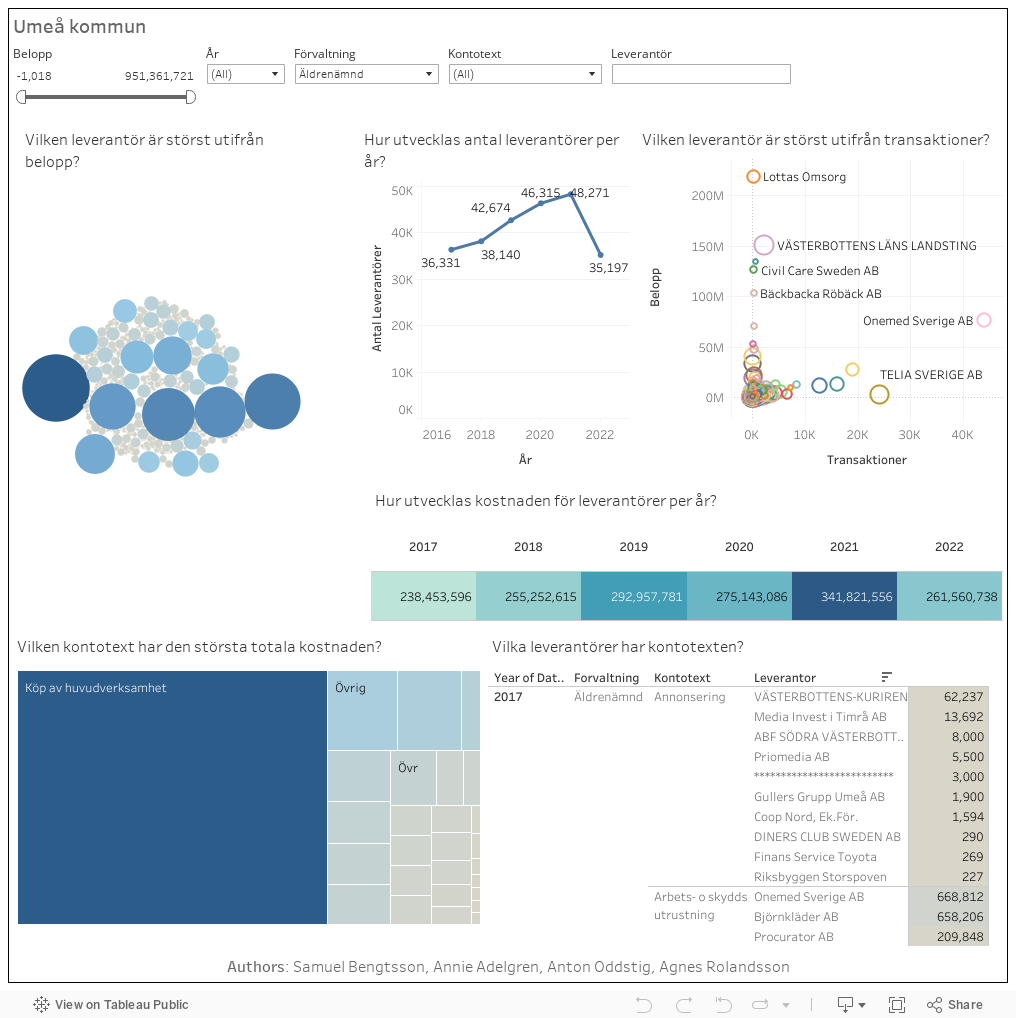
- Who: Systems Science students and municipalities of Södertälje, Varberg, Örebro, and Umeå.
- What: Analysis of open data on public spending
- How: Dashboards and visualization combined with qualitative case analysis
If the dashboards below do not display properly, follow the fullscreen links: Cross-municipality comparison, Södertälje, Örebro, Varberg, Umeå.
Cross municipality comparison